WECS (Workload Execution Cluster Space) Remote Monitoring
1. Introduction
What is WECS?
WECS (Workload Execution Cluster Space) is a comprehensive monitoring interface designed for visualizing and managing remote workloads across multiple Kubernetes clusters. It provides a unified view of your distributed infrastructure, allowing operations teams and developers to inspect resources, view live logs, and troubleshoot issues without needing direct access to each cluster’s API server.
Purpose
The primary purpose of WECS is to facilitate remote cluster monitoring. It bridges the gap between centralized management and distributed execution, ensuring that users have full visibility into the state of their applications regardless of where they are running.
When to use
Use WECS when you need to:
- Monitor workloads deployed via the Binding Policy (BP) mechanism.
- Debug application failures in remote clusters.
- Verify that resources are correctly propagated and running.
- Access container logs in real-time.
Key Benefits
- Real-time Visibility: Instant updates on resource status and cluster health.
- Live Logs: Stream logs directly from remote containers via WebSocket.
- Hierarchical Organization: Intuitive tree view for navigating complex multi-cluster environments.
- WebSocket-based Efficiency: Low-latency data transmission for immediate feedback.
📖 Terminology for Beginners
To get the most out of this guide, it’s helpful to understand a few key terms:
- ITS (Inventory Transform Service): The central “phonebook” where KubeStellar keeps track of all your managed clusters.
- WECS (Workload Execution Cluster Space): The monitoring engine that lets you see and touch remote resources in real-time.
- Binding Policy (BP): A set of rules you define to tell KubeStellar which workloads should go to which clusters.
- Staged Workloads: A “pre-flight” area where you can inspect workloads before they are actually deployed to remote clusters.
✅ Readiness Checklist
Before you begin, ensure you have:
- Your management cluster (KubeFlex) running.
- At least remote cluster (e.g.,
cluster1) joined via ITS. - A Binding Policy created to target your workloads.
Beginner Quick Guide
If you are new to KubeStellar, follow these steps to get your remote monitoring up and running quickly:
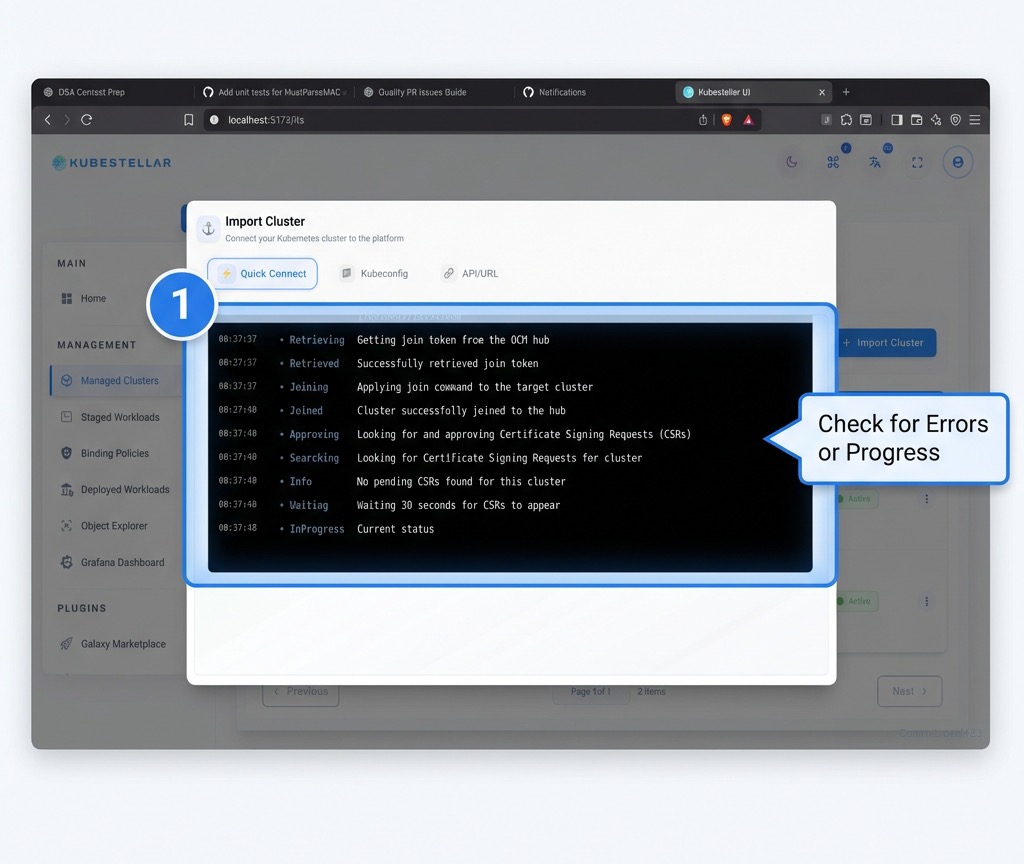
1. Import your Clusters
Before monitoring, ensure your clusters are imported into the Inventory Transform Service (ITS). Navigate to Infrastructure > Managed Clusters to see your fleet.
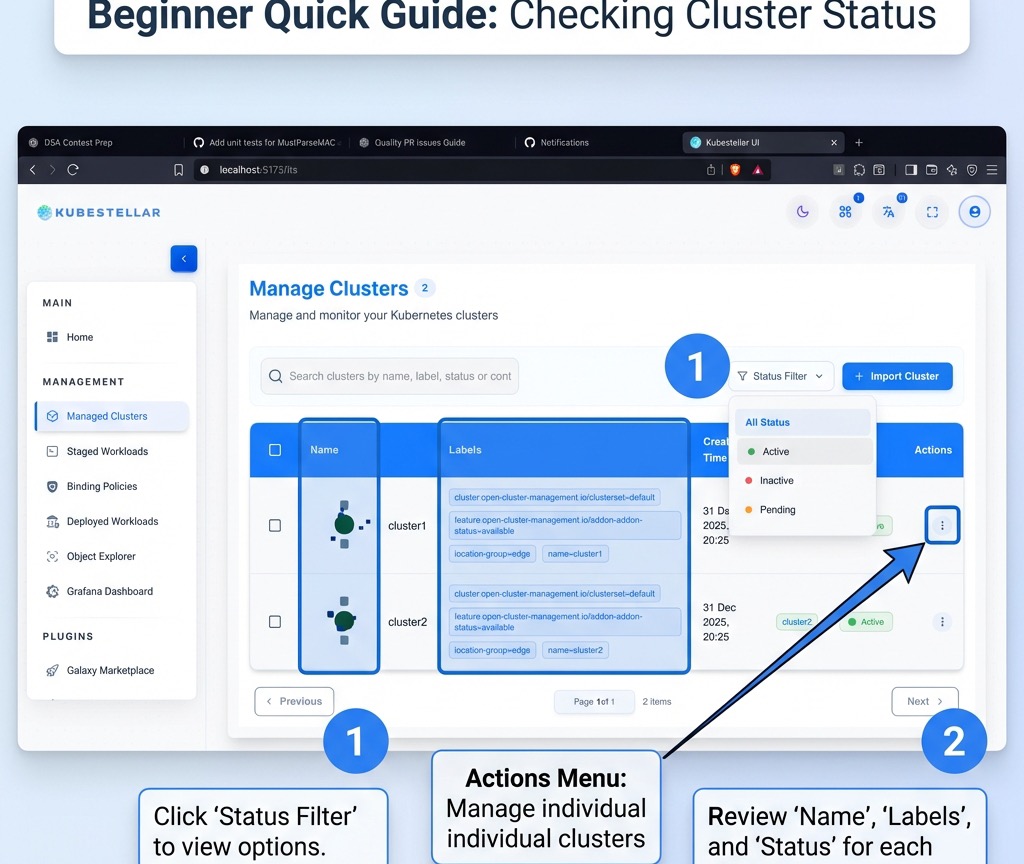
2. Verify Cluster Status
Check the status of your clusters. You can filter by Active, Inactive, or Pending to ensure everything is healthy.
[!TIP] If a cluster is stuck in “Pending”, click on the cluster to view the Import Logs for real-time debugging of the join process.
3. Monitor Cluster Capacity
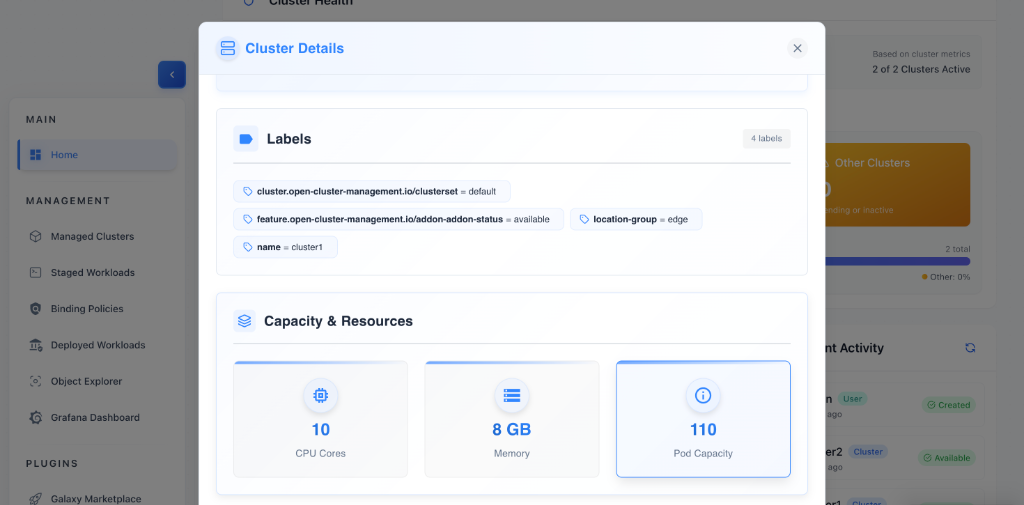
Understand the resource limits and health of your clusters at a glance. The Cluster Details view provides essential metadata and resource metrics.
Quick Guide: Understanding Cluster Health
- Identify Labels: Check the top section for cluster-specific metadata. This helps you identify cluster roles, regions, and settings (e.g.,
location-group). - Monitor CPU Cores: View the total computational power available for your remote workloads.
- Check Memory (GB): Keep an eye on the RAM capacity to ensure memory-intensive applications have sufficient head-room.
- Verify Pod Capacity: See the maximum number of pods the cluster can support, which is critical for scaling assessments.
4. Inspect Staged Workloads & Namespaces
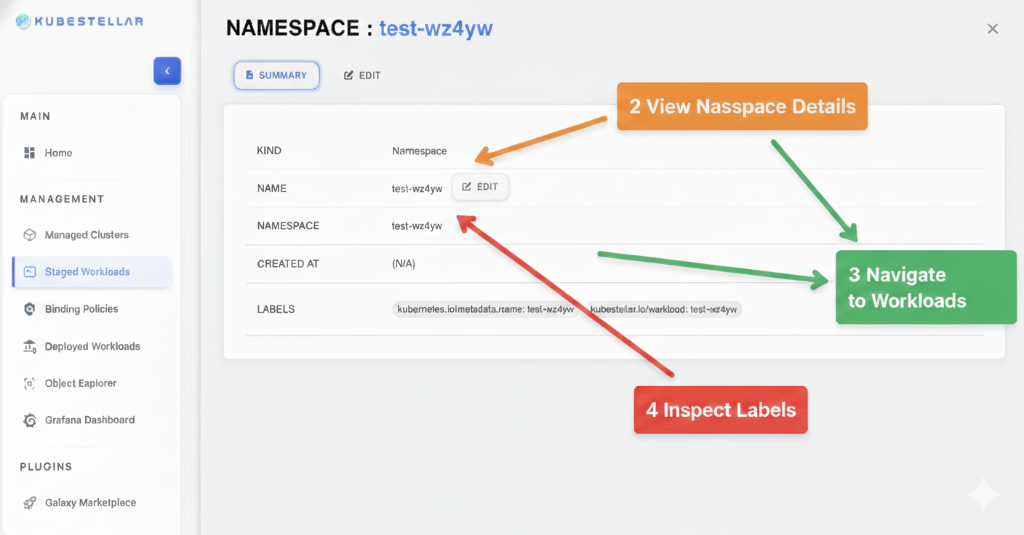
Before diving into live remote resources, use the Staged Workloads view to inspect your configurations and metadata at the namespace level.
Quick Guide: Namespace Exploration
- View Namespace Details (2): Gain an immediate overview of the resource Kind, Name, and Namespace to verify staging accuracy.
- Navigate to Workloads (3): Transition from metadata overview to granular workload management by clicking the workload associations.
- Switch to Edit Mode (3): Jump directly into the configuration by clicking the Edit tab or the inline edit icon to make quick adjustments.
- Inspect Labels (4): Review and audit the Labels assigned to the namespace, which are critical for proper Binding Policy application.
5. Deploy and Manage Workloads
WECS streamlines the lifecycle of your distributed workloads. Use the Manage Workloads interface to visualize cross-cluster deployments and perform granular management actions.
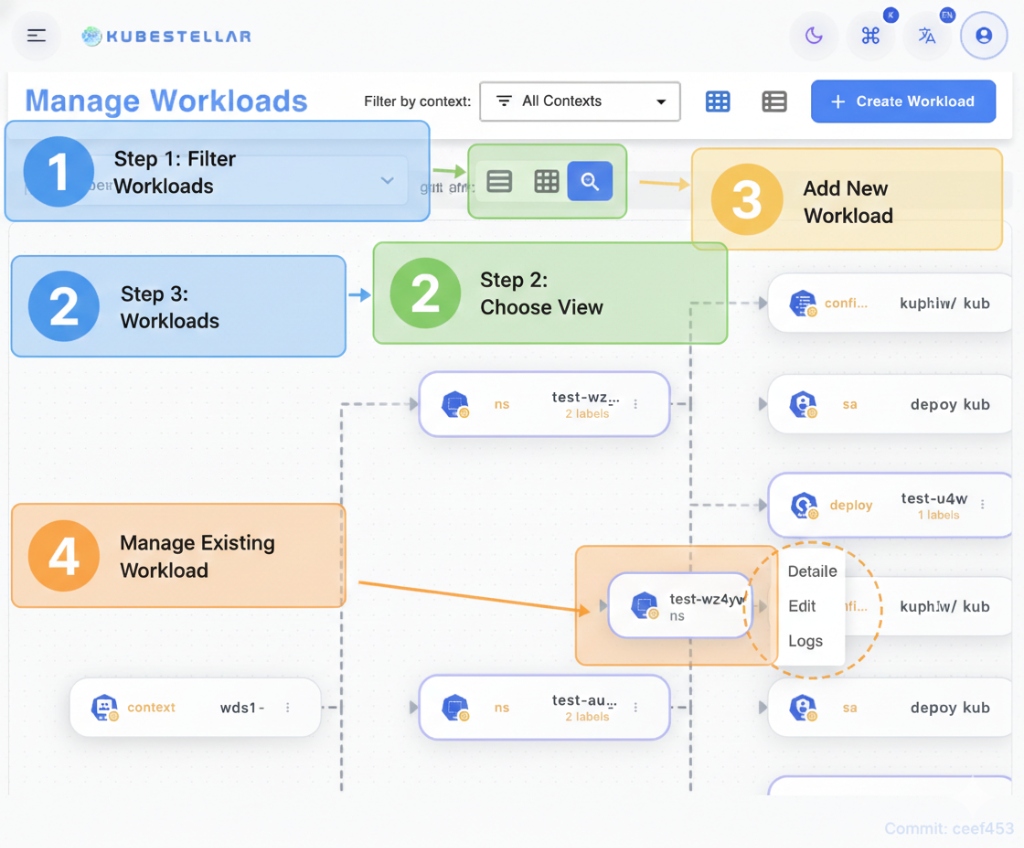
Quick Guide: Workload Operations
- Filter Workloads (1): Use the context and namespace filters to focus on specific segments of your infrastructure.
- Choose View (2): Toggle between Grid, List, and Tree views to find the most effective visualization for your current task.
- Browse Workloads (3): Inspect the health and configuration of all workloads managed by your Binding Policies.
- Manage Resources (4): Hover over any workload node to access the Actions Menu, where you can jump directly to Details, Edit the manifest, or view Logs.
- Create New (5): Click + Create Workload to define and deploy new resources directly from the UI.
6. Explore Remote Resources workloads are deployed, go to Deployed Workloads (WECS) to start exploring the live state of your clusters using the hierarchical tree view.
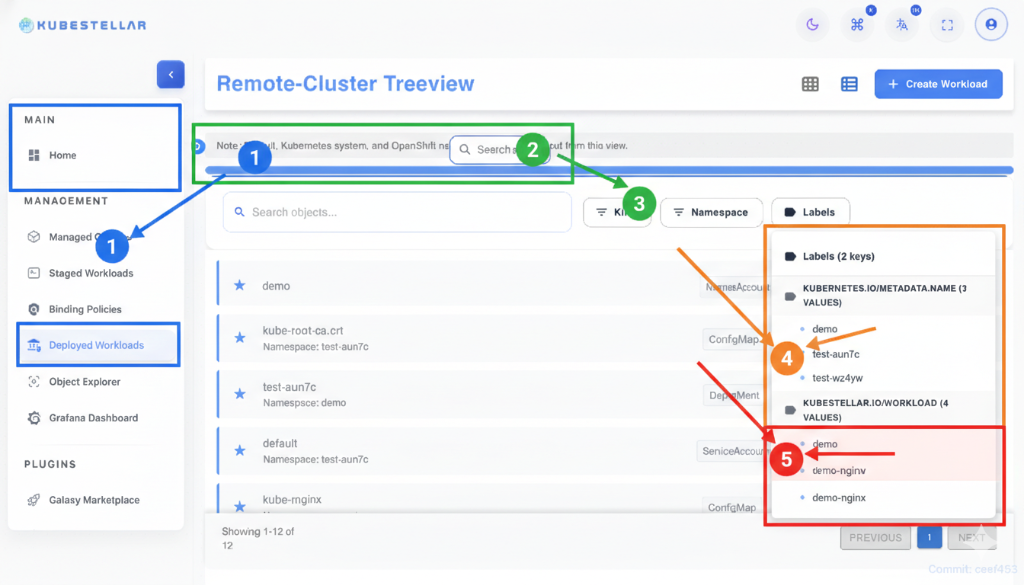
Quick Guide: Tree View Mastery
- Navigate (1): Click Deployed Workloads in the sidebar to enter the tree view.
- Search (2): Use the inline search to find specific objects across all namespaces.
- Refine (3): Use the Kind and Namespace filters to focus on your target resources.
- Audit (4/5): Inspect Labels and Keys in the right panel to verify resource properties.
2. Prerequisites
Before using the WECS remote monitoring features, ensure the following prerequisites are met:
- Clusters Imported: Target clusters must be imported into the Inventory Transform Service (ITS).
- Workloads Deployed: Workloads should be deployed and managed via Binding Policies (BP).
- WECS Agent: The WECS agent must be running on the remote clusters (if required for your specific architecture).
- Network Connectivity: Ensure network connectivity between the WECS backend and the remote clusters.
- WebSocket Support: The client browser and network path must support WebSocket connections for real-time streaming.
3. Feature Overview
WECS Architecture
The WECS architecture is designed for real-time, bi-directional communication:
Data Flow:
- Cluster → WebSocket → Backend: Agents or API watchers on remote clusters stream changes to the backend.
- Backend → Cache: Data is cached for performance and quick retrieval.
- Backend → Frontend: The frontend receives real-time updates via a WebSocket connection.
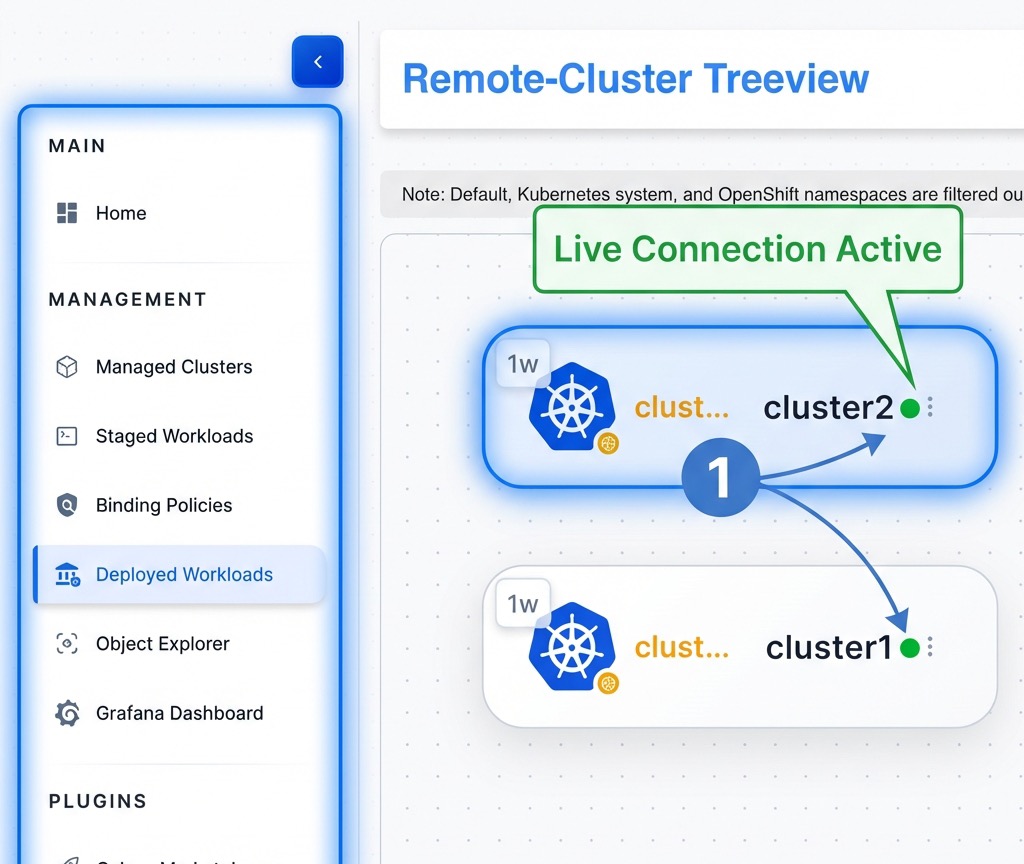
WebSocket Connection Model
- Live Connection: Maintains a persistent WebSocket connection to selected clusters.
- Automatic Reconnection: Automatically attempts to reconnect if the connection is dropped, featuring a smart backoff retry strategy.
- Connection Indicators:
- 🟢 Connected: Real-time stream active.
- 🟡 Connecting: Attempting to establish connection.
- 🔴 Disconnected: Connection lost, click to reconnect.
- Connection Pooling: Efficiently manages connections to multiple clusters simultaneously.
- Data Updates: Incremental updates for resource changes (Created, Updated, Deleted).
Resource Hierarchy
WECS organizes resources in a logical, drill-down tree structure:
- Cluster (Top Level): Displays cluster name, status, and total resource count.
- Namespace: Groups resources logically, color-coded by status.
- Resource Type (e.g., Deployments, Pods): Grouped by Kind.
- Resource Instance: Specific named resource with status icons (Running/Pending/Failed).
- Sub-resources: e.g., individual Pods within a Deployment.
- Resource Instance: Specific named resource with status icons (Running/Pending/Failed).
- Resource Type (e.g., Deployments, Pods): Grouped by Kind.
- Namespace: Groups resources logically, color-coded by status.
4. Step-by-Step Guides
Guide 1: Navigating the WECS Tree
- Open WECS Page: Navigate to the WECS section of the application.
- View Monitored Clusters: You will see a list of top-level nodes for each monitored cluster.
- Visual Indicator: Check the connection status dot (🟢 Connected, 🟡 Connecting, 🔴 Disconnected).
- Expand Cluster: Click the arrow or name of a cluster to reveal its Namespaces.
- Info: Shows resource counts per cluster.
- View Namespaces: Browse the list of Namespaces containing managed resources.
- Filter: namespaces with resources are displayed.
- Expand Namespace: Click a Namespace to see the grouped Resource Types (e.g., Deployments, Services).
- Select Resource Type: Click on a type (e.g., “Pods”) to expand and list individual resources.
- View Details: Click on a specific resource name to open the Resource Details Panel.
Guide 1.1: Viewing and Editing Cluster Summary
- Select Cluster Node: Click on the top-level cluster node (e.g.,
cluster1) in the tree view. - View Summary: The right panel will display the Cluster Summary, including:
- Kind: Resource kind (Cluster).
- Name: Name of the cluster.
- Context: The context used for connection.
- Created At: Timestamp of creation.
- Labels: Associated labels.
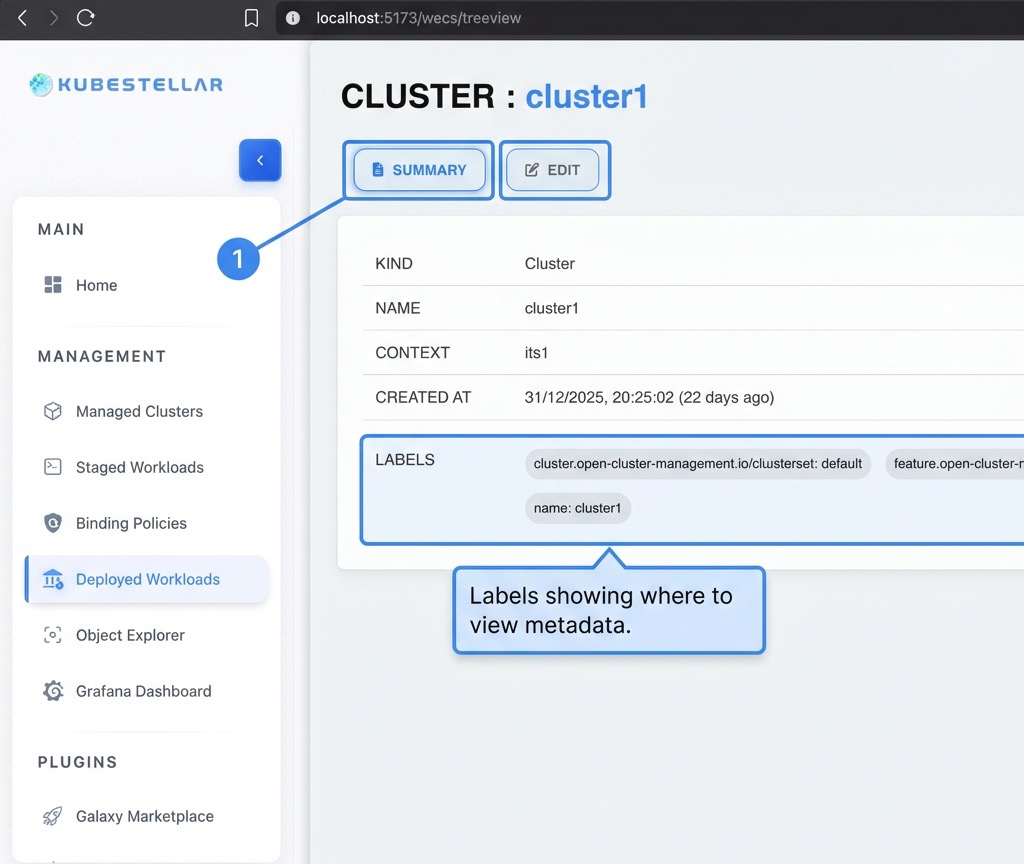
- Edit Configuration: Switch to the Edit tab to view or modify the cluster’s YAML/JSON configuration.
- Toggle between YAML and JSON views.
- Make changes and click Update to apply.
Guide 2: Viewing Resource Details
-
Navigate to Resource: Use the tree view to find the specific resource you want to inspect.
-
Click Resource Name: This opens the detail panel on the right side.
-
Resource Details Tabs:
- Summary:
- Basic Info: Resource Name, Namespace, Kind, Cluster, Creation Timestamp, UID, Resource Version, API Version.
- Status: Overall status (Ready/Not Ready), Replicas (Desired/Available), Conditions (Type/Status/Reason/Message).
- Labels/Annotations: Complete key-value pairs with copy functionality.
- Spec: Selector, Images, Ports, Env Variables, Volume Mounts, Requests/Limits.
- Edit: Full YAML/JSON manifest editor with syntax highlighting, line numbers, and copy/download/save options.
- Logs: Live multi-container log streaming with search, filter, and tail controls.
- Events: History of events with timestamps, types (Normal/Warning), and messages.
- Summary:
Quick Guide: Mastering Resource Management
WECS provides a unified interface for inspecting and modifying resources across all clusters. Use the Actions Menu and Detail Panels to manage your infrastructure.
- Summary View: Monitor the resource’s health, labels, and metadata in real-time without inspecting raw YAML.
- Live Editing: Switch to the Edit tab for a full-featured YAML/JSON editor to make instant updates.
- Real-time Logs: Stream container logs directly within the management panel for rapid troubleshooting.
- Event Audit: Track the history of normal and warning events associated with each resource.
Guide 3: Streaming Live Logs
- Open Resource Details: Navigate to a Pod or a controller (like a Deployment) that manages pods.
- Go to Logs Tab: Click the Logs tab in the details panel.
- Select Container: Dropdown to select container (supports multi-container, init, and sidecar).
- Configure View:
- Tail Lines: Select number of previous lines to load (50, 100, 500, All).
- Follow Mode: Toggle to auto-scroll as new logs arrive.
- Watch Real-time Logs: Observe the log stream.
- Visual Aid: ERROR logs in red, WARN in yellow, INFO in blue.
- Features: Line numbers, word wrap toggle, timestamp display.
- Controls:
- Search: Filter logs by keyword.
- Download: Export logs to file.
- Clear/Refresh: Manage the current view.
[!TIP] Use the Search bar within the logs view to quickly find error patterns or specific transaction IDs across large log streams.
Guide 4: Using Search and Filters
- Locate Filter Bar: Found at the top of the WECS interface or within specific views.
- Search by Name: Type a resource name (e.g.,
redis) in the global search bar to jump to it. - Filter by Status:
- Click the Status dropdown.
- Select Running, Pending, or Failed to narrow down the visible resources.
- Filter by Namespace: Use the namespace dropdown to focus on a specific environment (e.g.,
production). - Clear Filters: Click the Clear All button to reset the view to default.
5. Interactive Features
- Navigation:
- Breadcrumbs: Use top navigation to jump back levels.
- Back Button: Close detailed views to return to the tree.
- Search and Filter:
- Search: Find resources by name globally.
- Filter: Narrow down by Type, Namespace, or Status (Running/Pending/Failed).
- Actions:
- Refresh: Manually refresh cluster or resource data.
- Delete: Remove a resource (requires confirmation).
- Edit: Modify resource YAML directly.
- Export: Copy resource name or export YAML.
- Auto-Refresh:
- Toggle auto-refresh with configurable intervals (5s, 10s, 30s, 60s).
- View Last Updated timestamp.
6. Use Cases
Use Case 1: Troubleshooting Failed Deployments
Scenario: A deployment is showing 0/3 pods ready.
Solution:
- Navigate to the Deployment in the WECS tree.
- Check the Summary tab for Conditions. Look for “False” status on Availability.
- Switch to the Events tab. Look for “Warning” events (e.g.,
FailedScheduling,ImagePullBackOff). - If the issue is application-related, find the child Pod.
- Open the Logs tab to see stack traces or errors.
Use Case 2: Live Log Monitoring
Scenario: Monitoring application rollout errors. Solution:
- Open the main Pod for your application.
- Go to the Logs tab and select the app container.
- Enable Follow mode.
- Use Search to highlight “Exception” or specific error codes.
- Download logs for offline analysis.
Use Case 3: Multi-Cluster Health Check
Scenario: Verifying critical service health across regions. Solution:
- In the tree view, collapse all clusters to top-level.
- Verify the Status Indicator is green for all clusters.
- Compare Resource Counts to ensure symmetry across regions.
- Click on the service in each cluster to verify “Active” or “Ready” status.
7. Resource Type Coverage
WECS supports monitoring a wide range of Kubernetes resources:
| Category | Resources |
|---|---|
| Workloads | Deployments, StatefulSets, DaemonSets, ReplicaSets, Jobs, CronJobs, Pods |
| Discovery & LB | Services, Endpoints, Ingresses |
| Config | ConfigMaps, Secrets |
| Storage | PersistentVolumes, PersistentVolumeClaims, StorageClasses |
| Custom | CRDs and dynamic resource type detection |
8. Troubleshooting
[!WARNING] If you cannot establish a connection, please ensure your network allows WebSocket traffic (WSS).
Common Issues and Solutions
| Issue | Symptoms | Potential Solutions |
|---|---|---|
| WebSocket disconnects | Indicator flashes red/yellow; logs stop. | Check local network; verify firewall rules; check backend timeouts. |
| Logs not streaming | Empty logs tab or indefinite spinner. | Verify Pod is Running; check container selection; verify WECS Agent health. |
| Resources missing | Tree view is empty or incomplete. | Verify cluster is Connected; check namespace permissions; click Refresh. |
| Slow loading | Expanding nodes takes a long time. | Increase Auto-refresh interval; use filters to reduce load; reduce Tail Lines. |
9. API/Integration Reference
WECS exposes several internal endpoints for its operation:
GET /api/wecs/clusters- List monitored clustersGET /api/wecs/:cluster/resources- Get all resources for a clusterGET /api/wecs/:cluster/:namespace/:kind/:name- Get specific resource detailsGET /api/wecs/:cluster/logs- Stream logsGET /api/wecs/:cluster/events- Get resource events
10. Related Features
-
ITS Integration: WECS retrieves the list of clusters from the Inventory Transform Service.
-
Binding Policy (BP): WECS focuses on monitoring workloads that were deployed via Binding Policies.
-
Object Explorer: For a broader, non-cluster-specific view of resources across all managed clusters, use the Object Explorer.
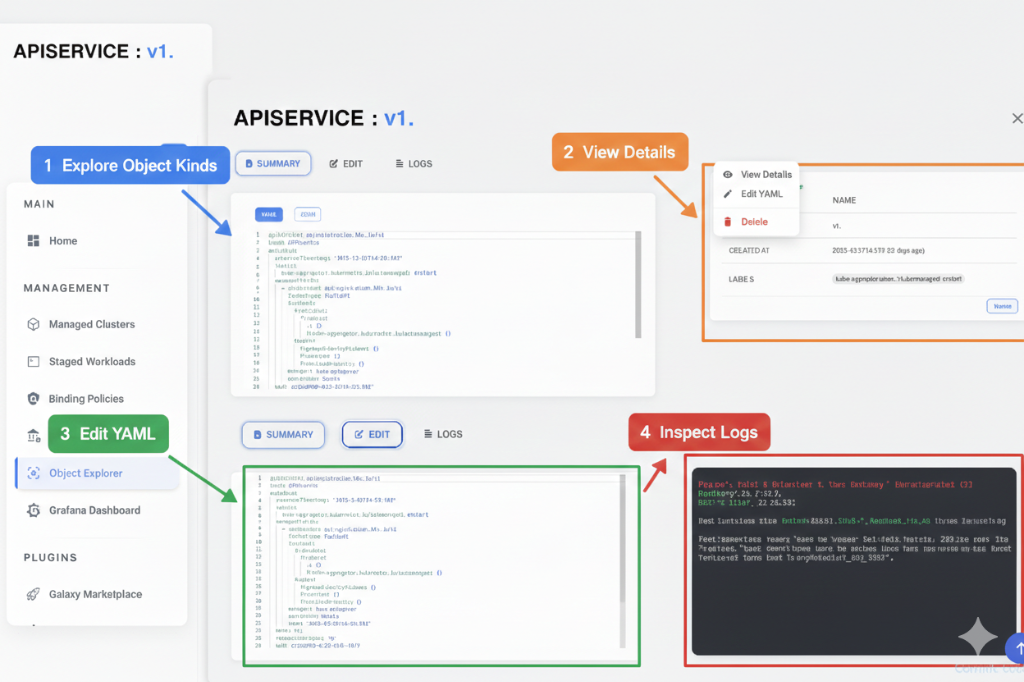
Quick Guide: Advanced Object Discovery
- Explore (1): Browse through all cluster namespaces and object kinds.
- View Details (2): Click on any object to open a detailed summary overlay.
- Edit YAML (3): Modify resource configurations directly with the integrated manifest editor.
- Inspect Logs (4): Stream live logs from your remote objects to troubleshoot in real-time.